VX Sport offers users the ability to live stream your team sessions to any web browser.
Note: you must have an internet connection to be able to stream a VX Live Session.
To run a live stream:
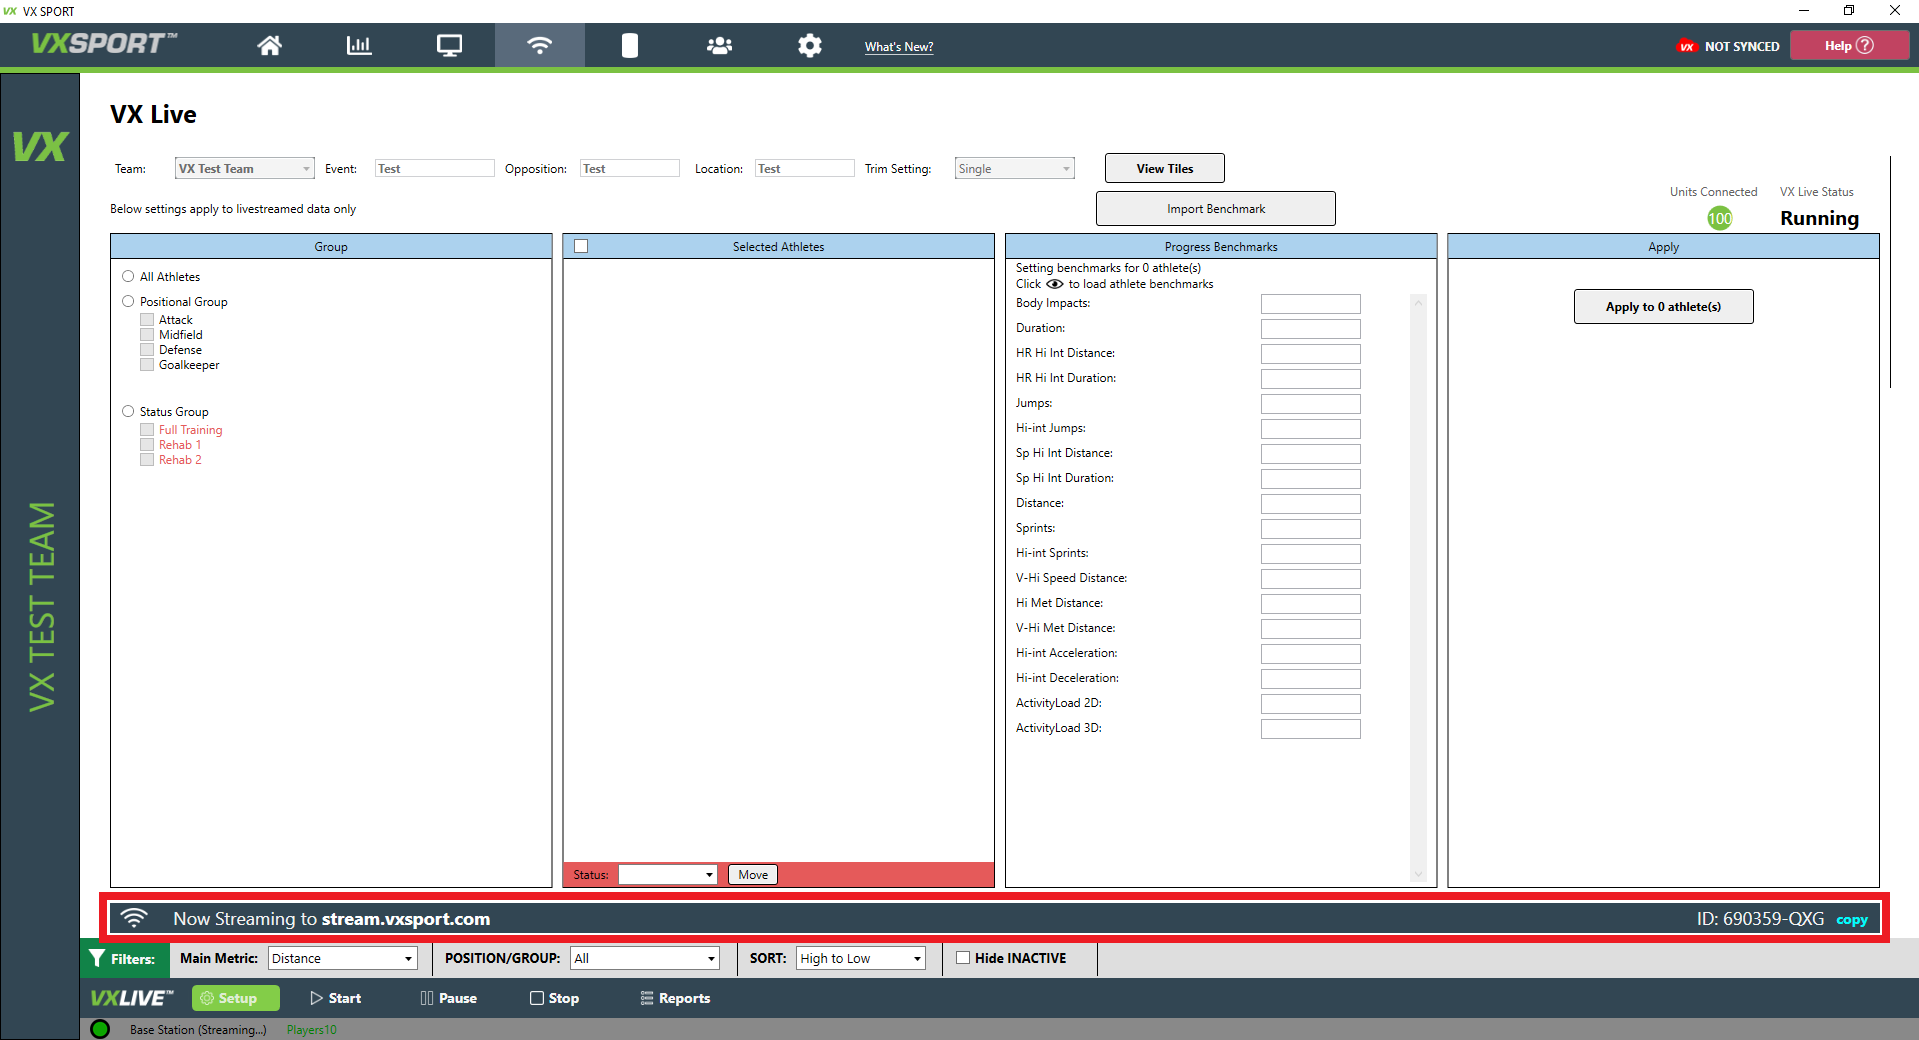
2. Once your athletes begin to populate, click the "Setup" button to get back to the menu screen where you will see a bar at the bottom of the screen that will say "Now Streaming to stream.vxsport.com," along with a session ID number on the right hand side of this bar.
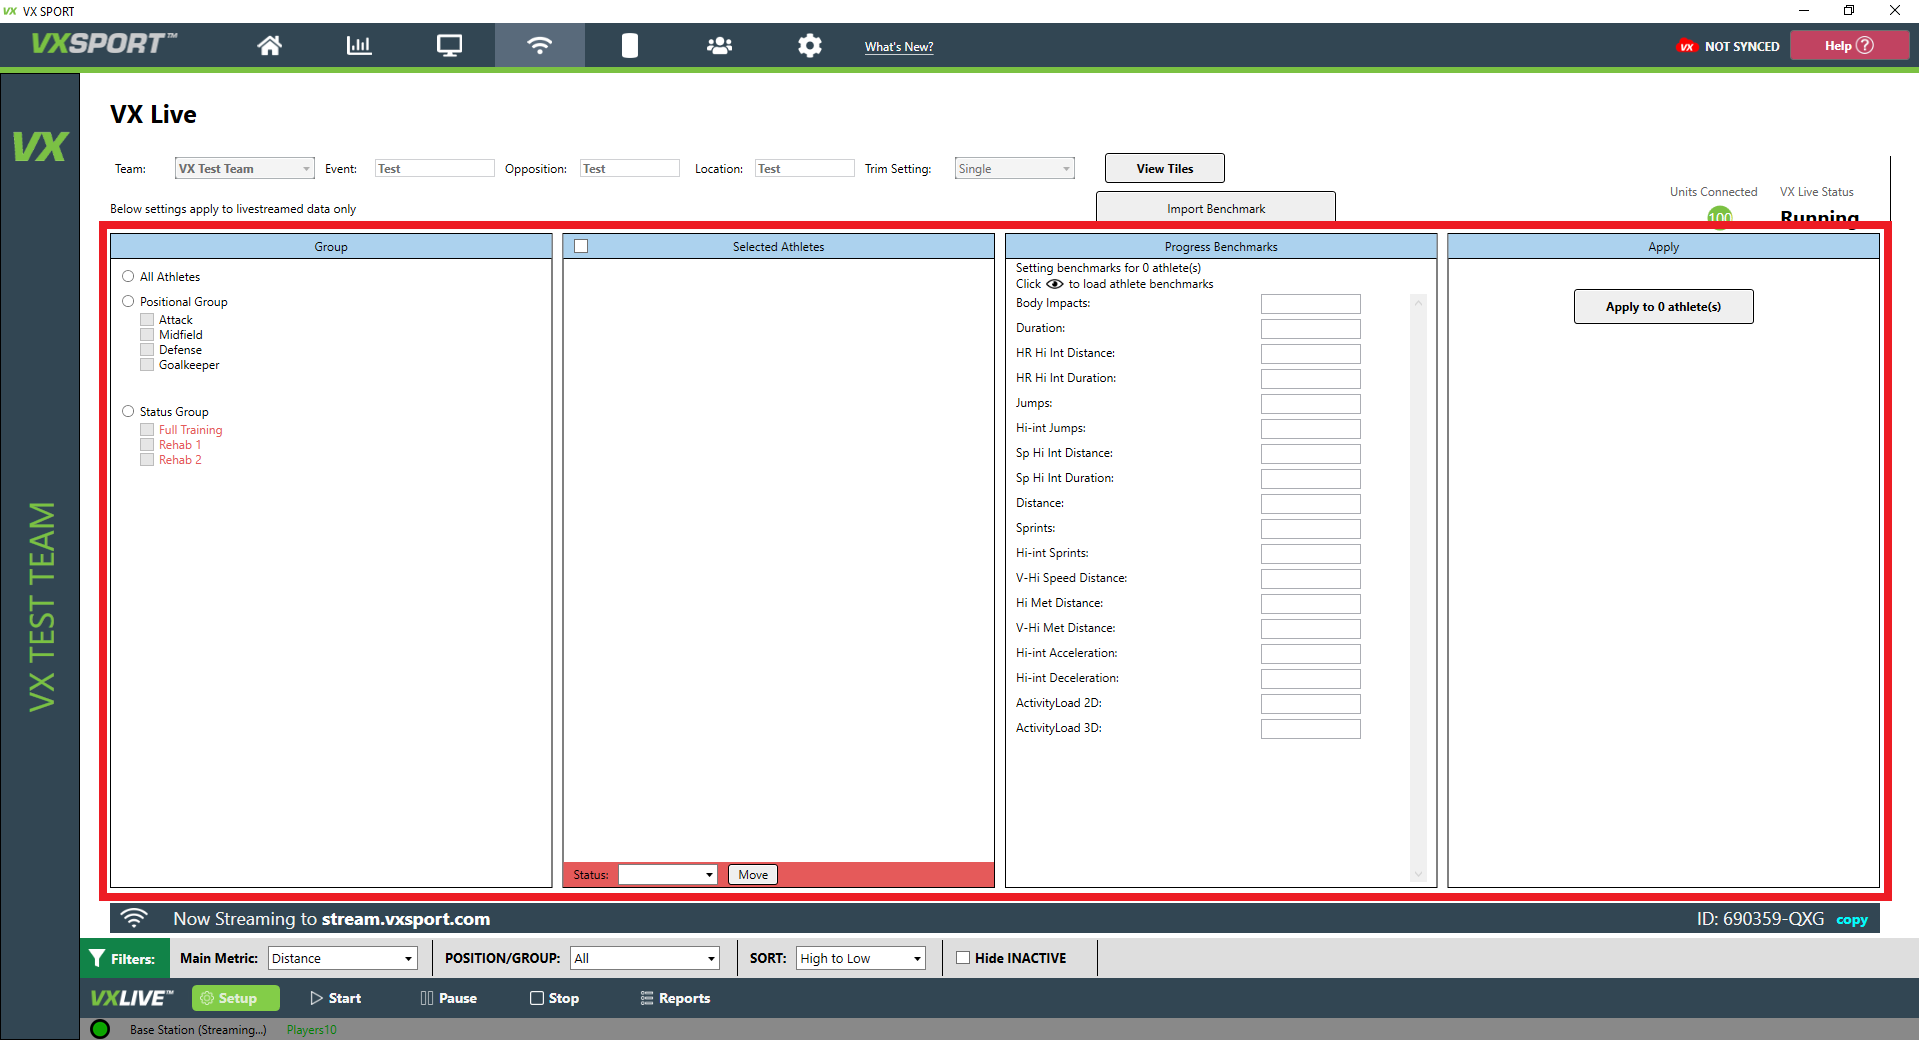
3. Wait for all your units to be detected in VX Live. You can see this in the green circle on the right-hand side of the screen. You can now set your athlete benchmarks to use in VX Live-Stream. Note: these can be set/changed at any time throughout the session.
a. Use the “all athletes” or “positional groups” to filter between your athletes.
b. You may assign your athlete(s) to a “status group” by using the by using the drop-down box e.g. Full training, Rehab 1, Rehab 2. Make sure you press “move”.
c. Use the check-boxes in the second box to select athletes to apply benchmarks to. Enter in your benchmarks for those athletes and “apply”.
d. To view previously set benchmarks click on the “eye” icon.
4. If you haven't already make sure you click on the "start" button located at the top of the screen to begin.
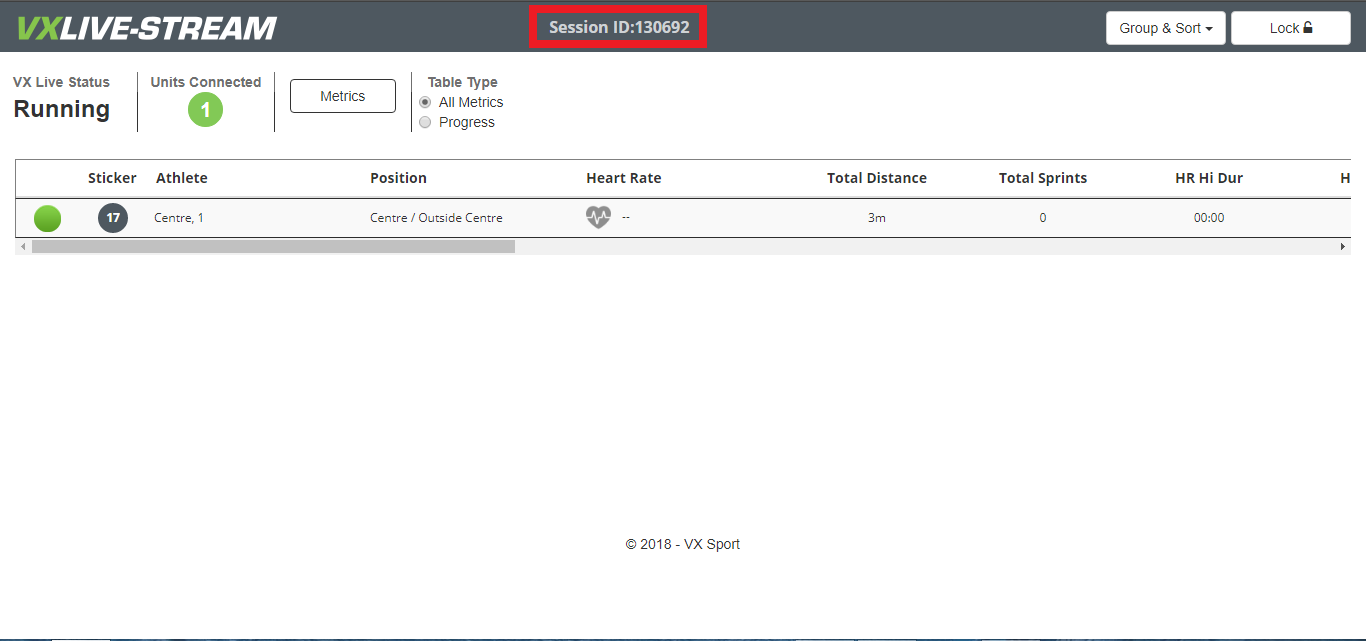
5. To view your Live-Stream data, either click on the stream.vxsport.com text in the blue box or enter stream.vxsport.com into a web browser, and enter in the 6-digit code when prompted. Note: Codes will last for 10 days.
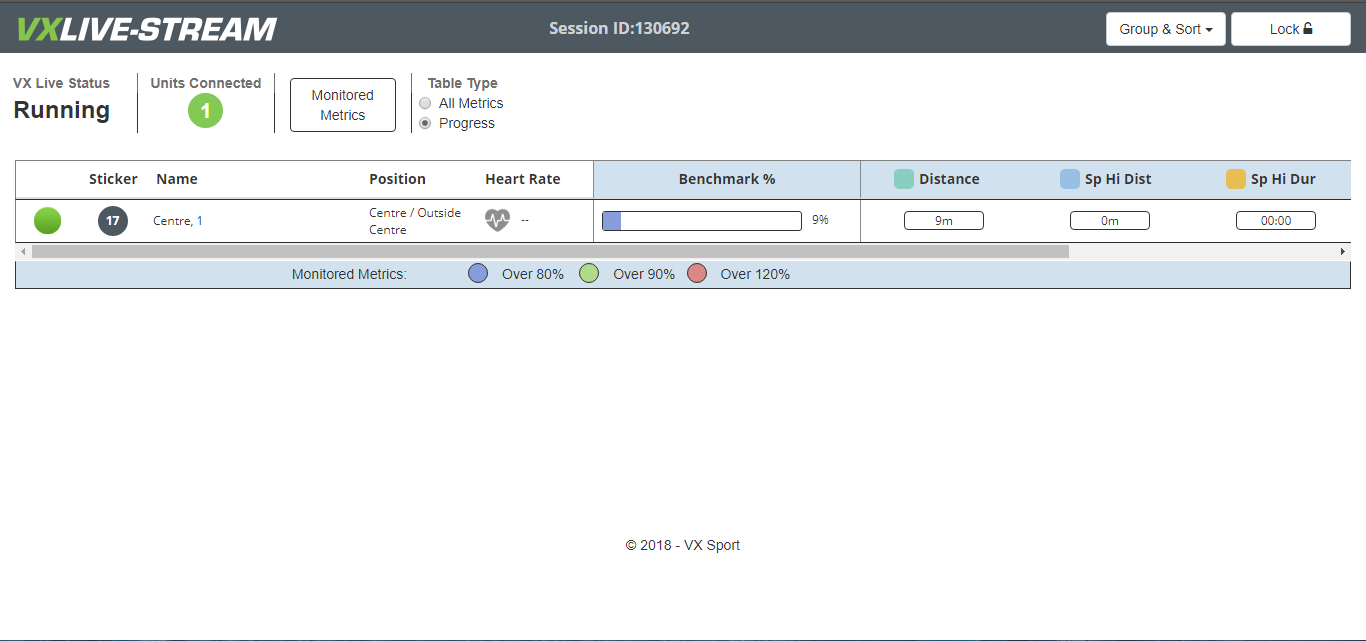
6. Updated benchmarks will appear on the live stream and a graph will be updated on how much of an athlete's benchmarks have be achieved. For example, if the distance benchmark is set at 100m and the athlete has run 9m, the graph will show that the benchmark has been 9% completed (as shown below).
Our alerts feature located in the progress table allows users to assign each athlete with specific individual loads, allowing users to visually see whether the athlete(s) are below or above their prescribed workloads/benchmarks. For example, once a workload reaches a threshold of 80%/90%/120% of the prescribed value the on-screen alerts will turn blue/green/red respectively, highlighting the changes in load.
VX Live-Stream Status Light Explanation
 |
Green - Connected and receiving data |
 |
Yellow - Joining VX Live |
 |
Red - Unit has temporarily lost connection - data will be updated upon unit reconnect. |
 |
Grey - Unit dropped out, no messages seen for 180 secs. |
0 Comments