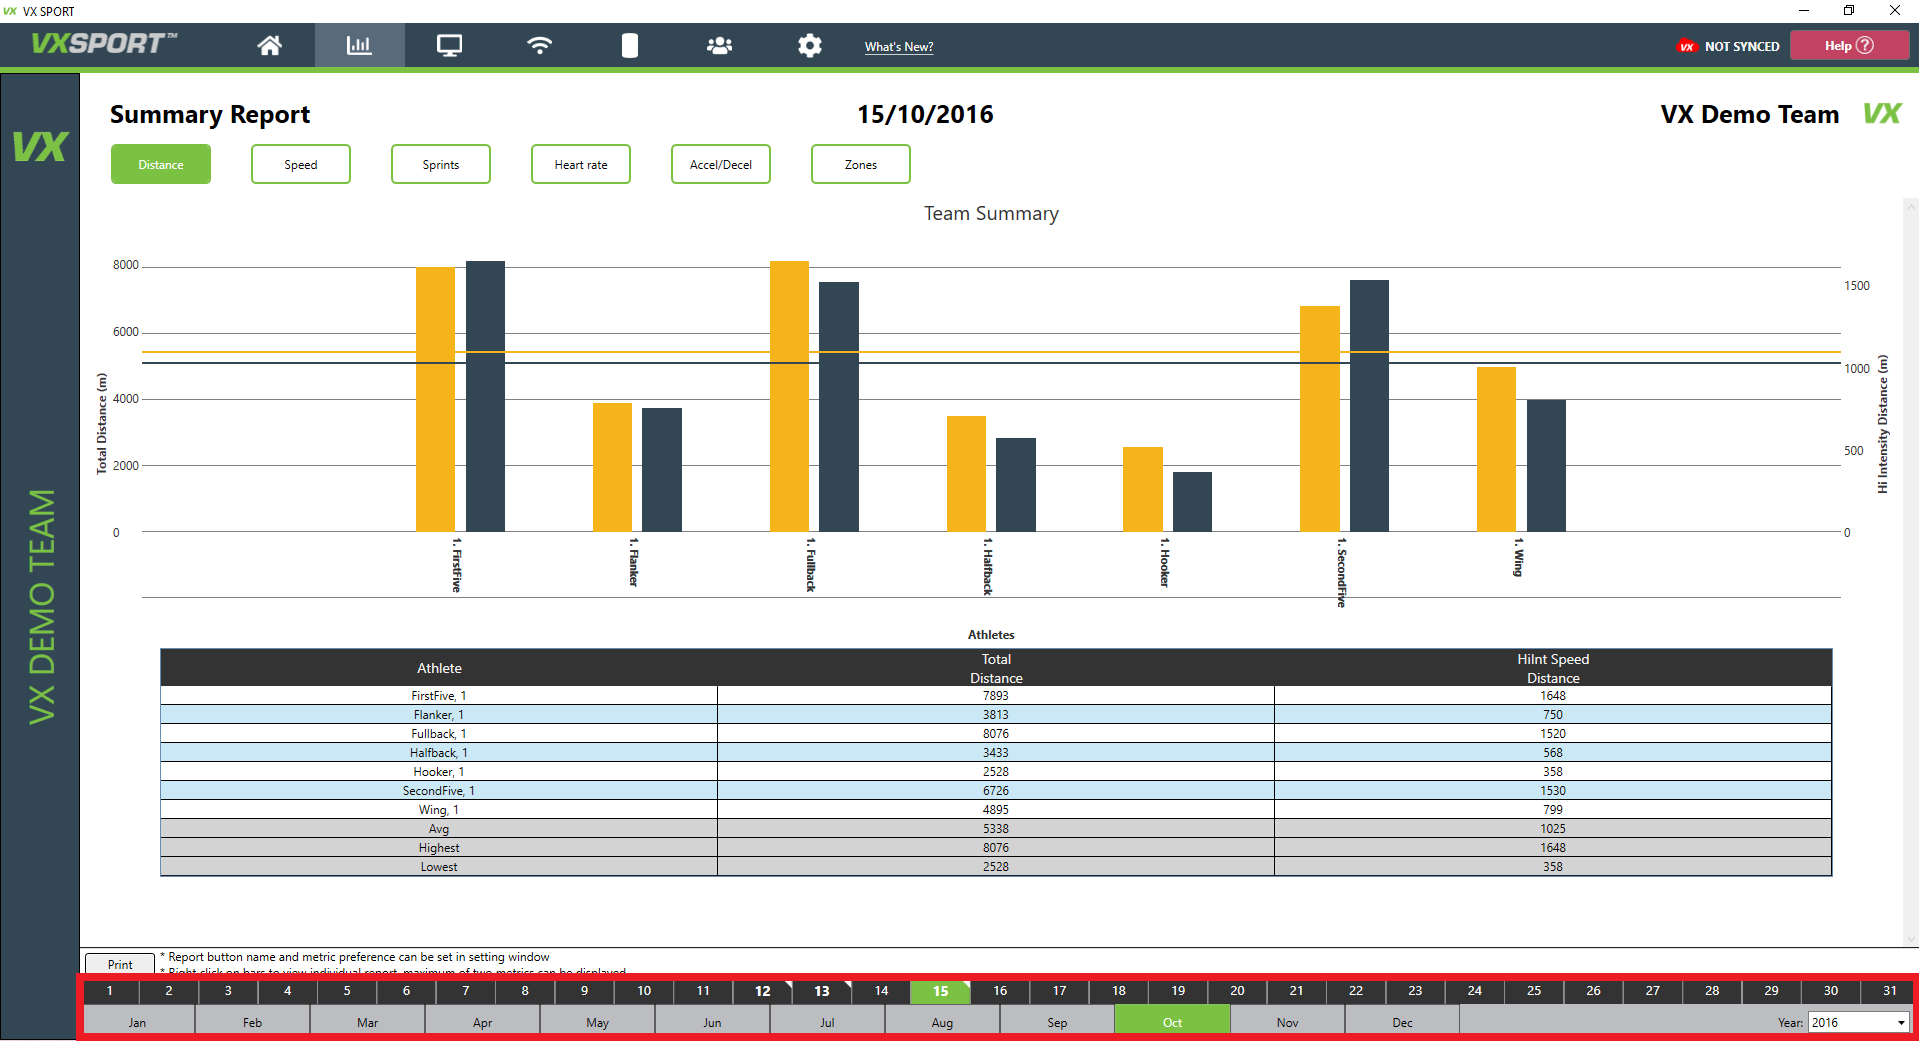
The Summary Report is a great tool to help you engage with your athletes. Shows them two selected metrics of your choice over six customizable reports. It also shows you at a glance who is above or below the average to help you find any red flags for the session.
1. Data is displayed in both graph and table form for easy viewing and comparisons between athletes.
2. To select which data you would like to view, choose a date from the calendar at the bottom of the screen. From here you can choose which year, month and day you would like.
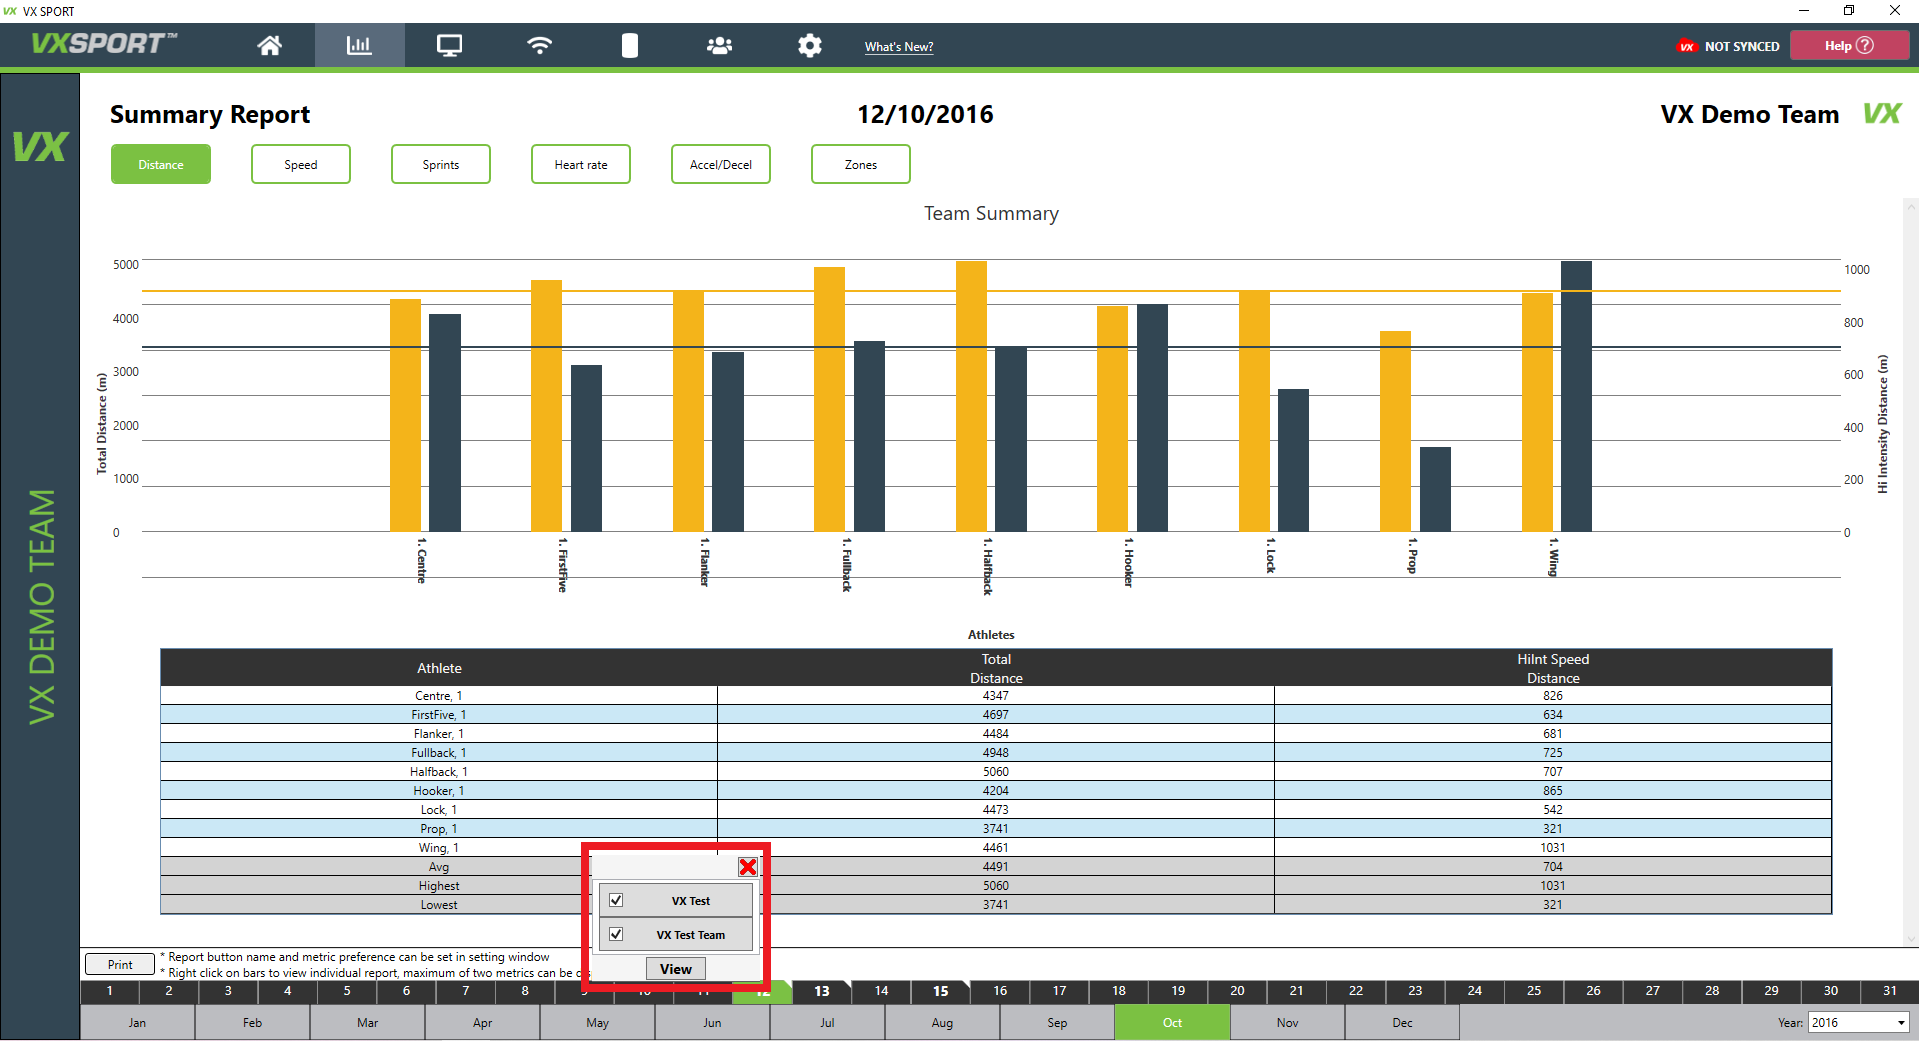
3. If there are multiple team's data on a day, you can select which team you would like to see/hide by hovering your mouse over the date and selecting/deselecting teams in the tick box then clicking "view."
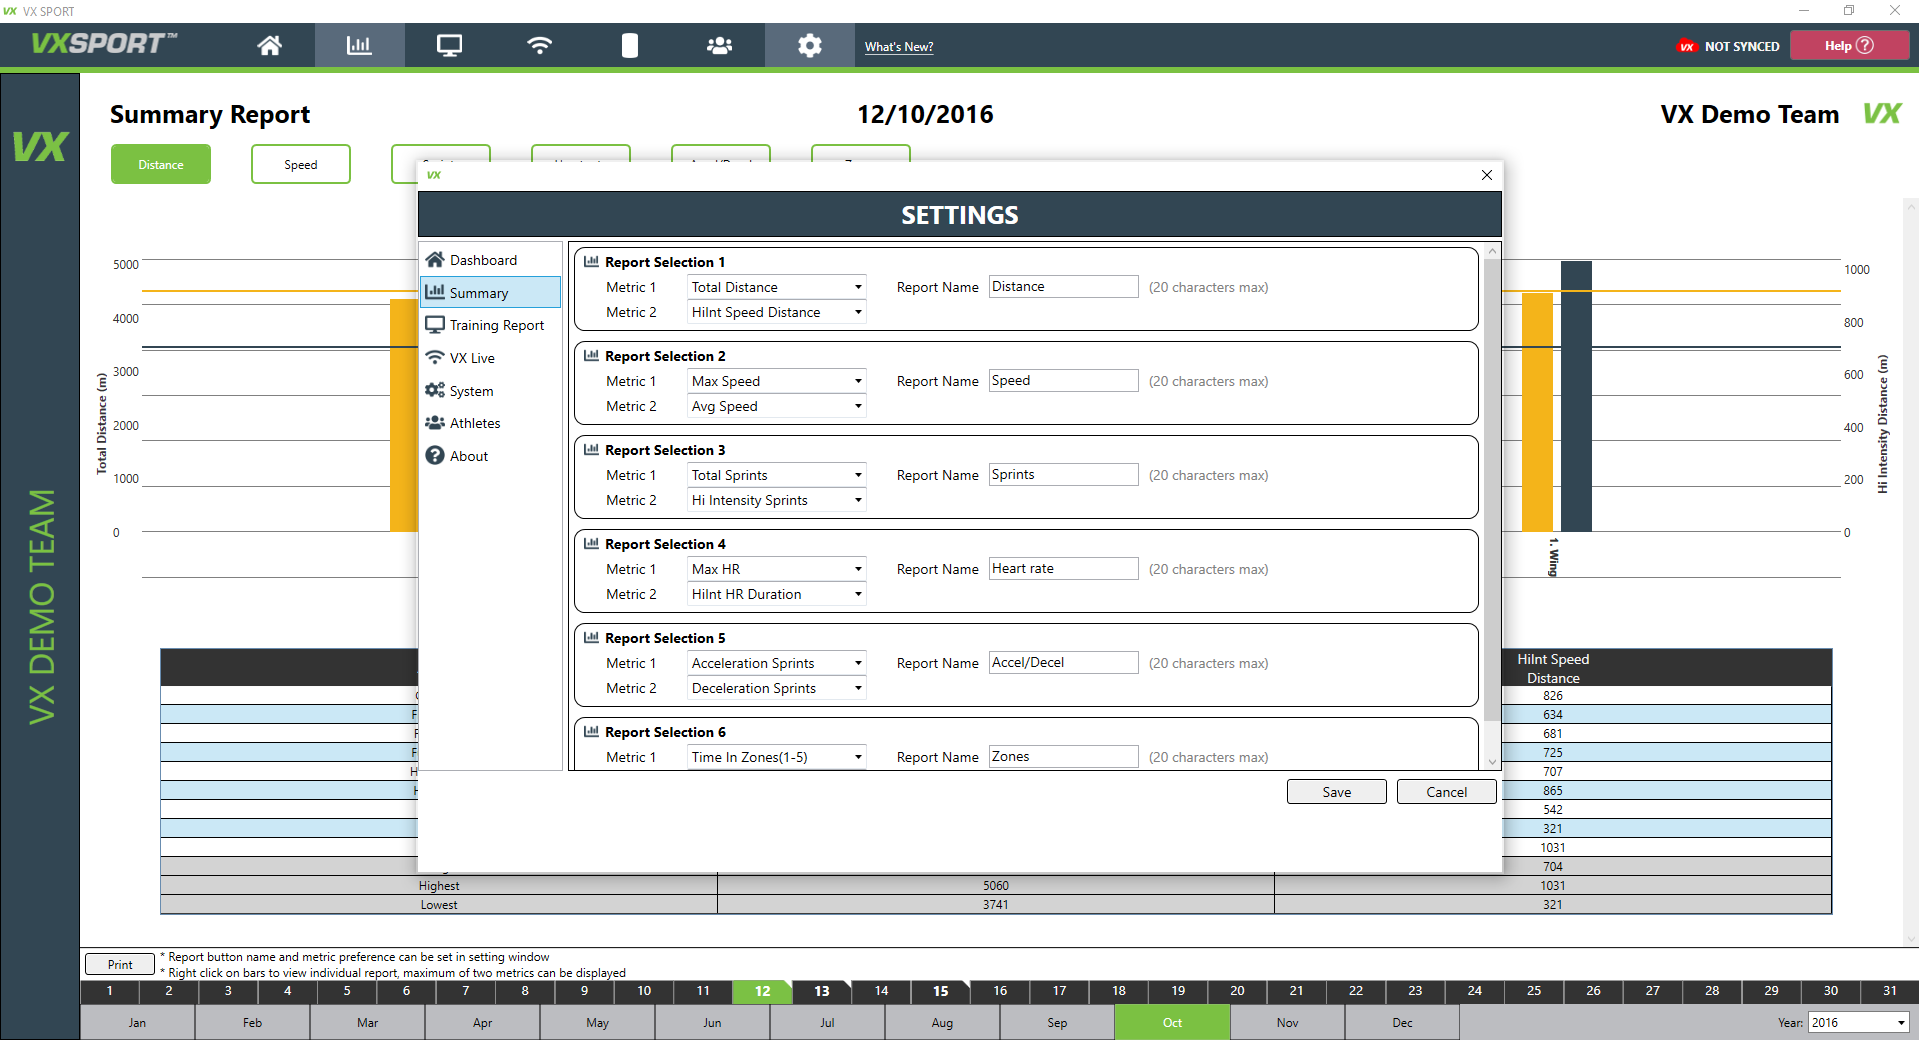
4. To customize which metrics you would like to see in the summary report, open the Settings menu and select Summary from the menu on the left hand side.
5. From here you can select which metrics appear on the summary graphs and tables. You can also customize the names for a quicker navigation.
0 Comments